Appearance
JSM Portal Project Dashboard
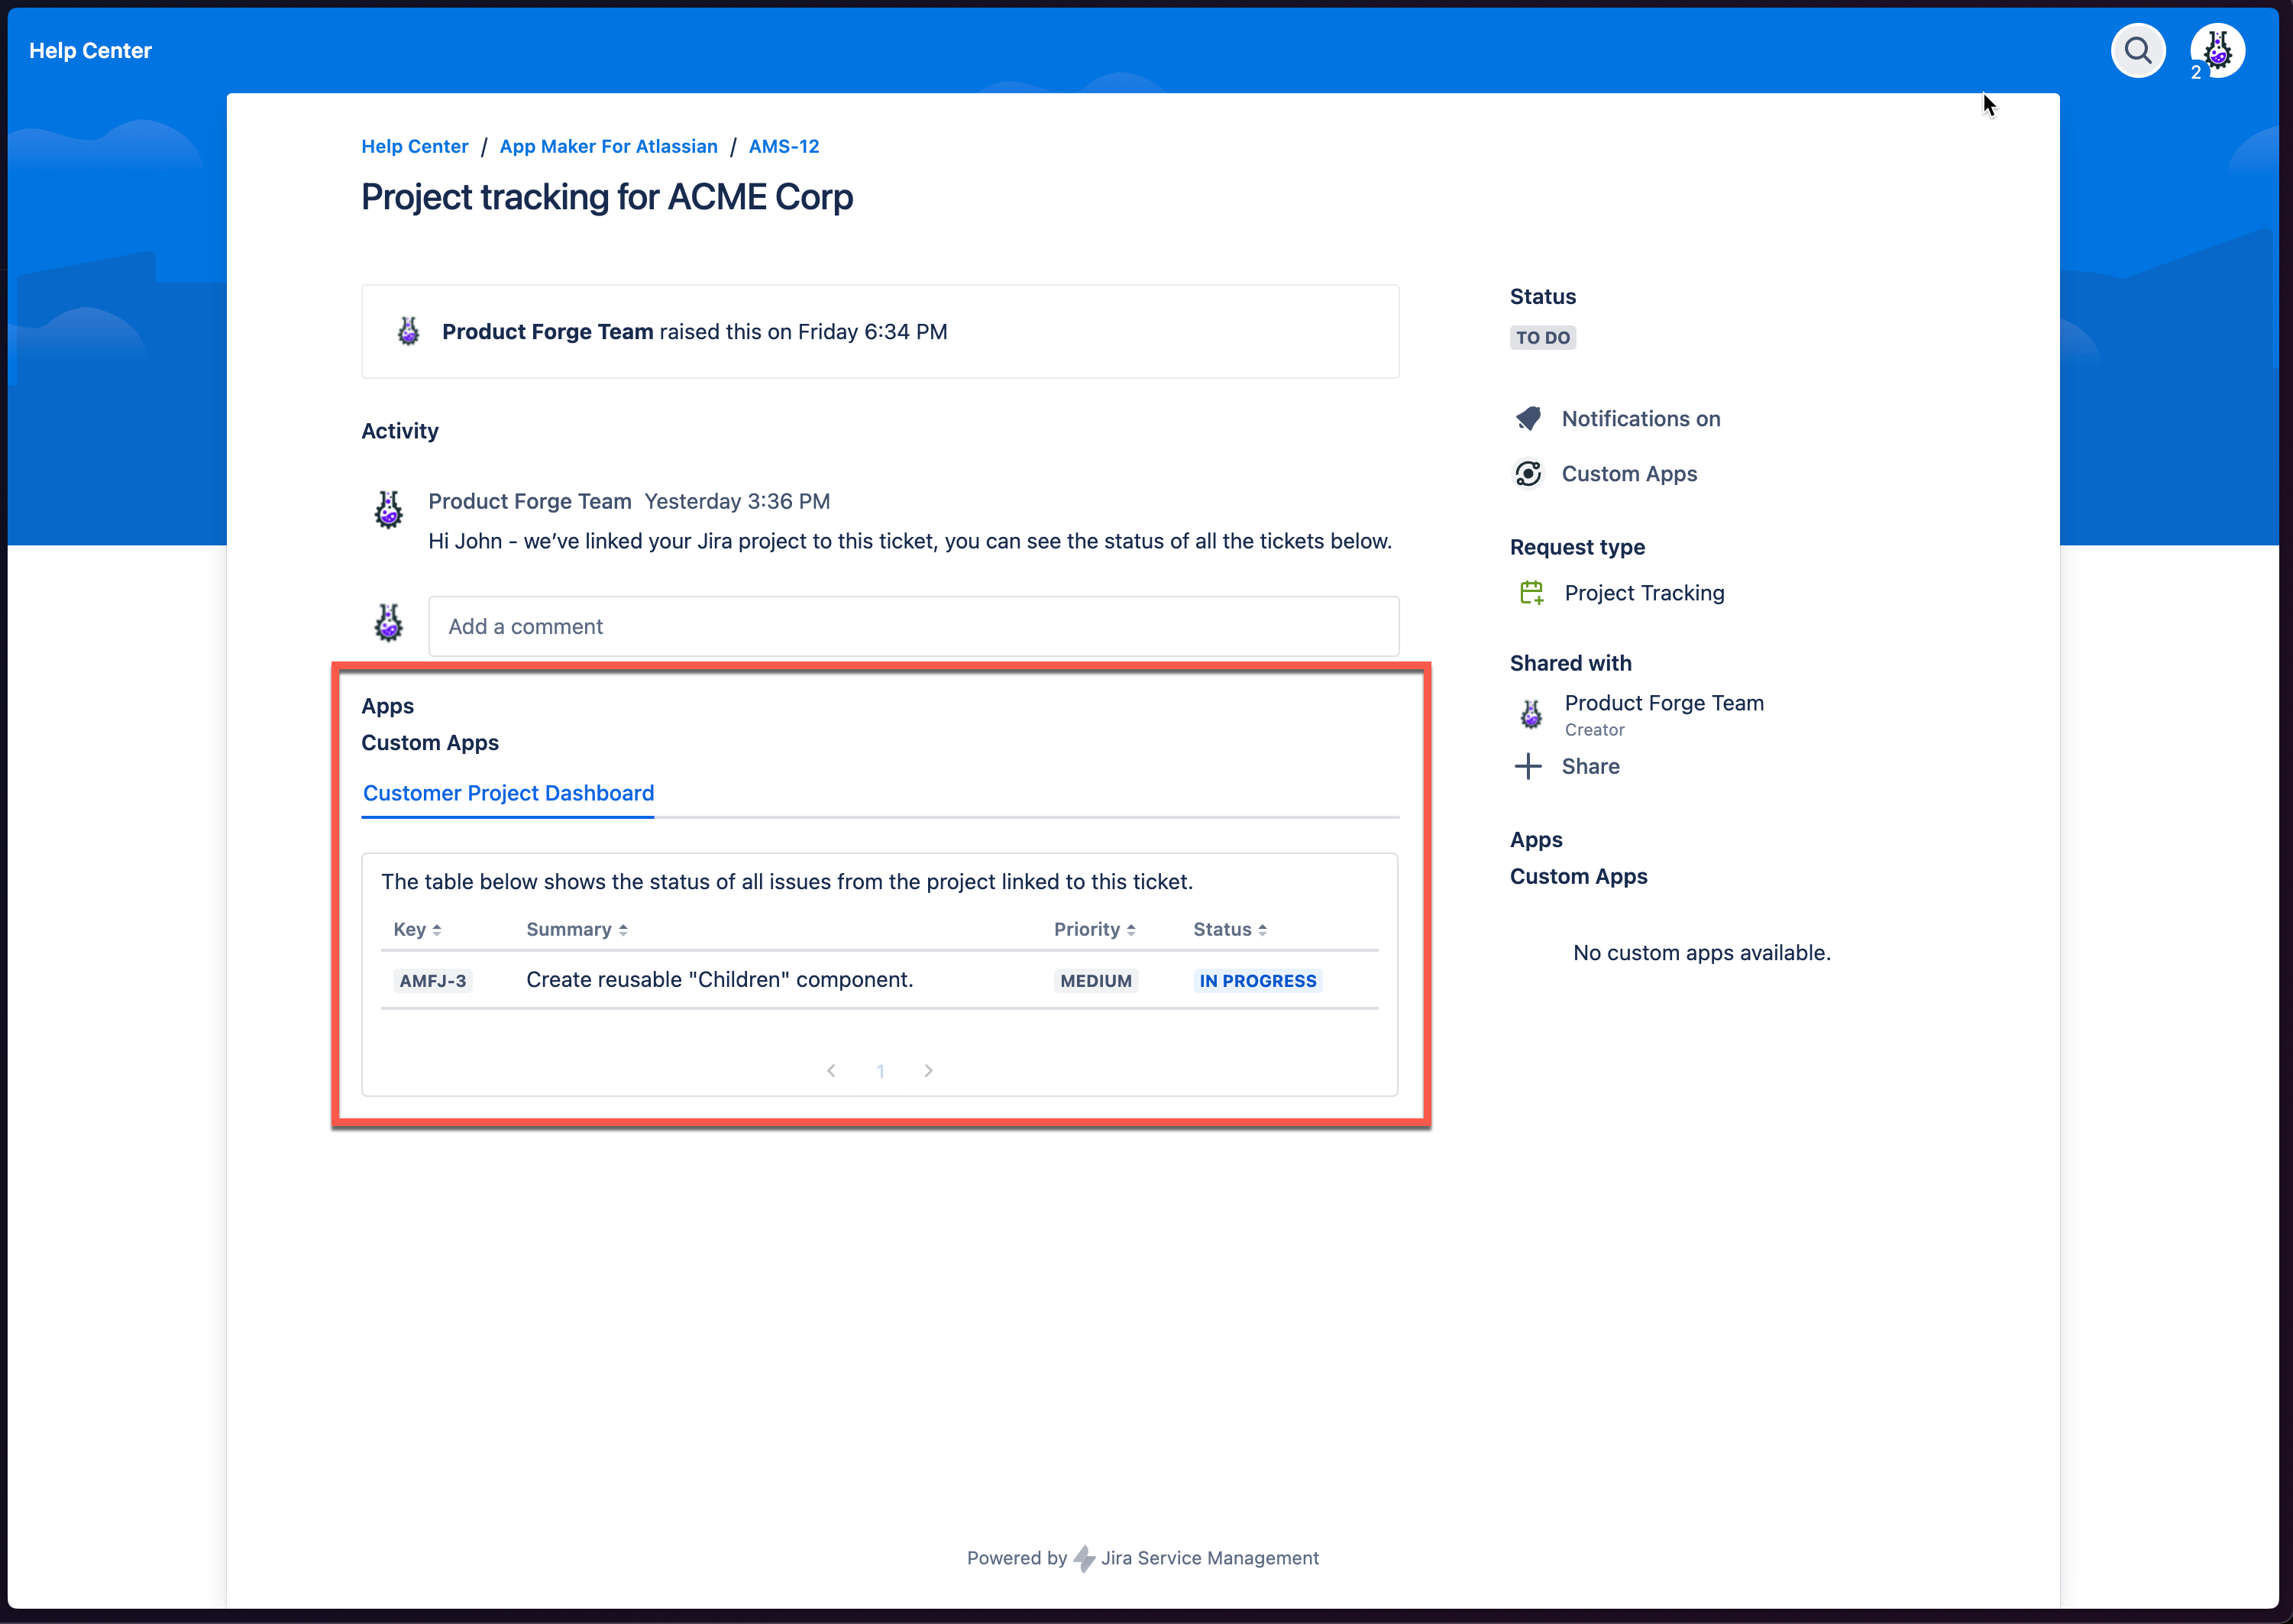
This example demonstrates how to display a dashboard of Jira Software issues that will display on a single Jira Service Management ticket.
- Different tickets will show the details of different Jira Software tickets.
- The Jira Software tickets to show are specified via a simple JQL query that is stored in a text field on the JSM ticket and can be set by the agent responding to the ticket.
- This example is useful for scenarios such as wanting to present a sub-set of Jira Software issues to a set of external stakeholders who do not have direct access to Jira Software.
JSW Project Dashboard screenshot
What You'll Need
- A Jira Software project with some issues
- A Jira Service Management project
- A new Request Type in the Jira Service Management project to use
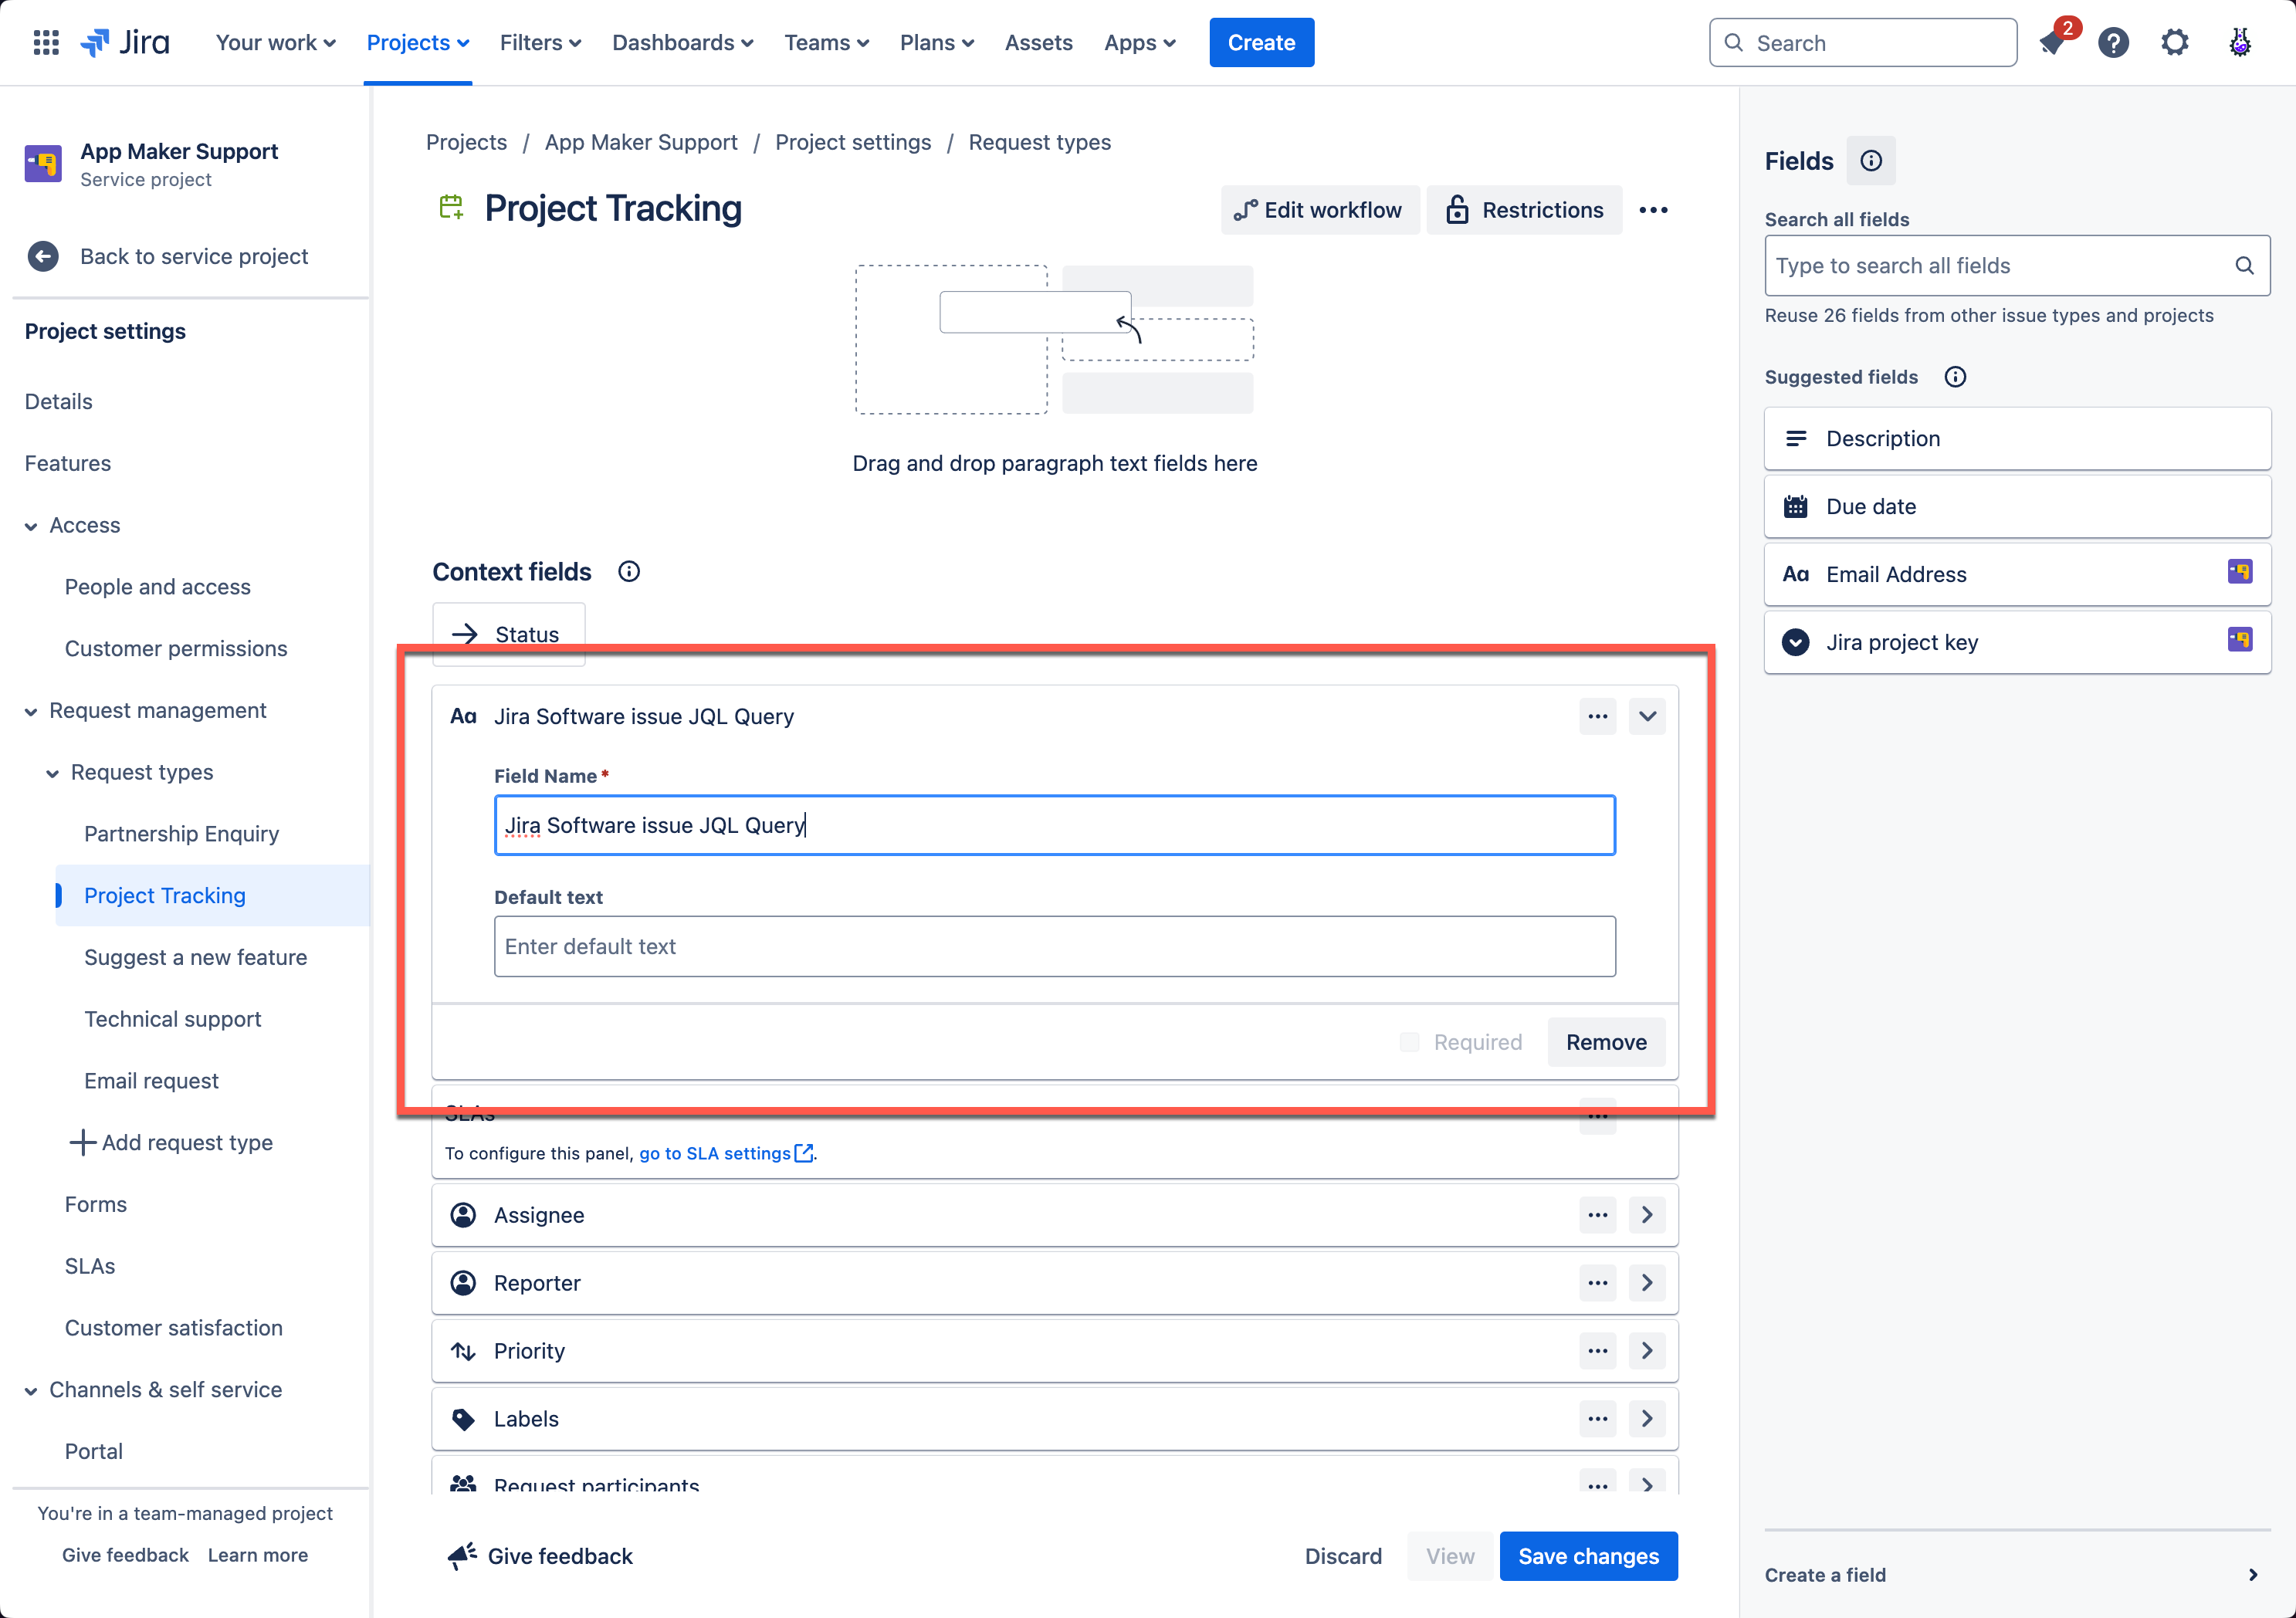
Creating the JQL Query Field
- Create a new text field in the Jira Service Management project to store the JQL query, call it something like "Jira Software issue JQL Query".
- Make sure it's only editable and visible by agents, not the person creating the ticket.
- Once created, make sure you find and store the custom field ID for the new field.
- There are guides on how to find the custom field ID here: How to find a custom field ID in Jira
JQL Query Field Configuration
Creating the UI Component in the JSM Portal
- Head to the App Maker settings area in Jira and create a new UI Component.
- The new component should use the
jiraServiceManagement:portalRequestDetailmodule. - It will also include a
DynamicTablecomponent to display the issues returned by the JQL query. - Finally, use the
jqlQuery:Template Function to fetch the issues based on the JQL query stored in the field on the JSM ticket you created earlier.- The
tableRowsproperty of theDynamicTablecomponent should look something like this:
- The
json
// swap `my_custom_field_id` with the custom field ID of the text field storing the JQL query.
"tableRows": "{{jqlQuery: jiraIssue.fields.my_custom_field_id}}"- The full JSON for the UI Component is below.
UI Component JSON for JSM Project Dashboard
json
{
  "action": "set",
  "resourceType": "site",
  "module": "jiraServiceManagement:portalRequestDetail",
  "title": "customer_project_jira_issues",
  "componentData": {
    "type": "TabPanel",
    "tabTitle": "Customer Project Dashboard",
    "children": [
      {
        "type": "BorderedCard",
        "children": [
          {
            "type": "ParagraphMedium",
            "content": "The table below shows the status of all issues from the project linked to this ticket."
          },
          {
            "type": "DynamicTable",
            "columnHeaders": [
              {
                "type": "TableHeader",
                "title": "Key",
                "valuePath": "key",
                "fieldType": "lozenge"
              },
              {
                "type": "TableHeader",
                "title": "Summary",
                "valuePath": "fields.summary"
              },
              {
                "type": "TableHeader",
                "title": "Priority",
                "fieldType": "lozenge",
                "valuePath": "fields.priority.name"
              },
              {
                "type": "TableHeader",
                "title": "Status",
                "fieldType": "lozenge",
                "valuePath": "fields.status.name",
                "appearanceMap": {
                  "success": [
                    "done",
                    "Done",
                    "DONE"
                  ],
                  "information": [
                    "IN PROGRESS",
                    "in progress",
                    "In Progress"
                  ]
                }
              }
            ],
            "tableRows": "{{jqlQuery: jiraIssue.fields.my_custom_field_id}}"
          }
        ]
      }
    ]
  }
}
Creating A Ticket in JSM and Populating the JQL Query Field
- Create a new ticket via the JSM portal using the new Request Type you created earlier.
- Once created, you'll see the new UI Component you created in the ticket view, but it won't have any data yet.
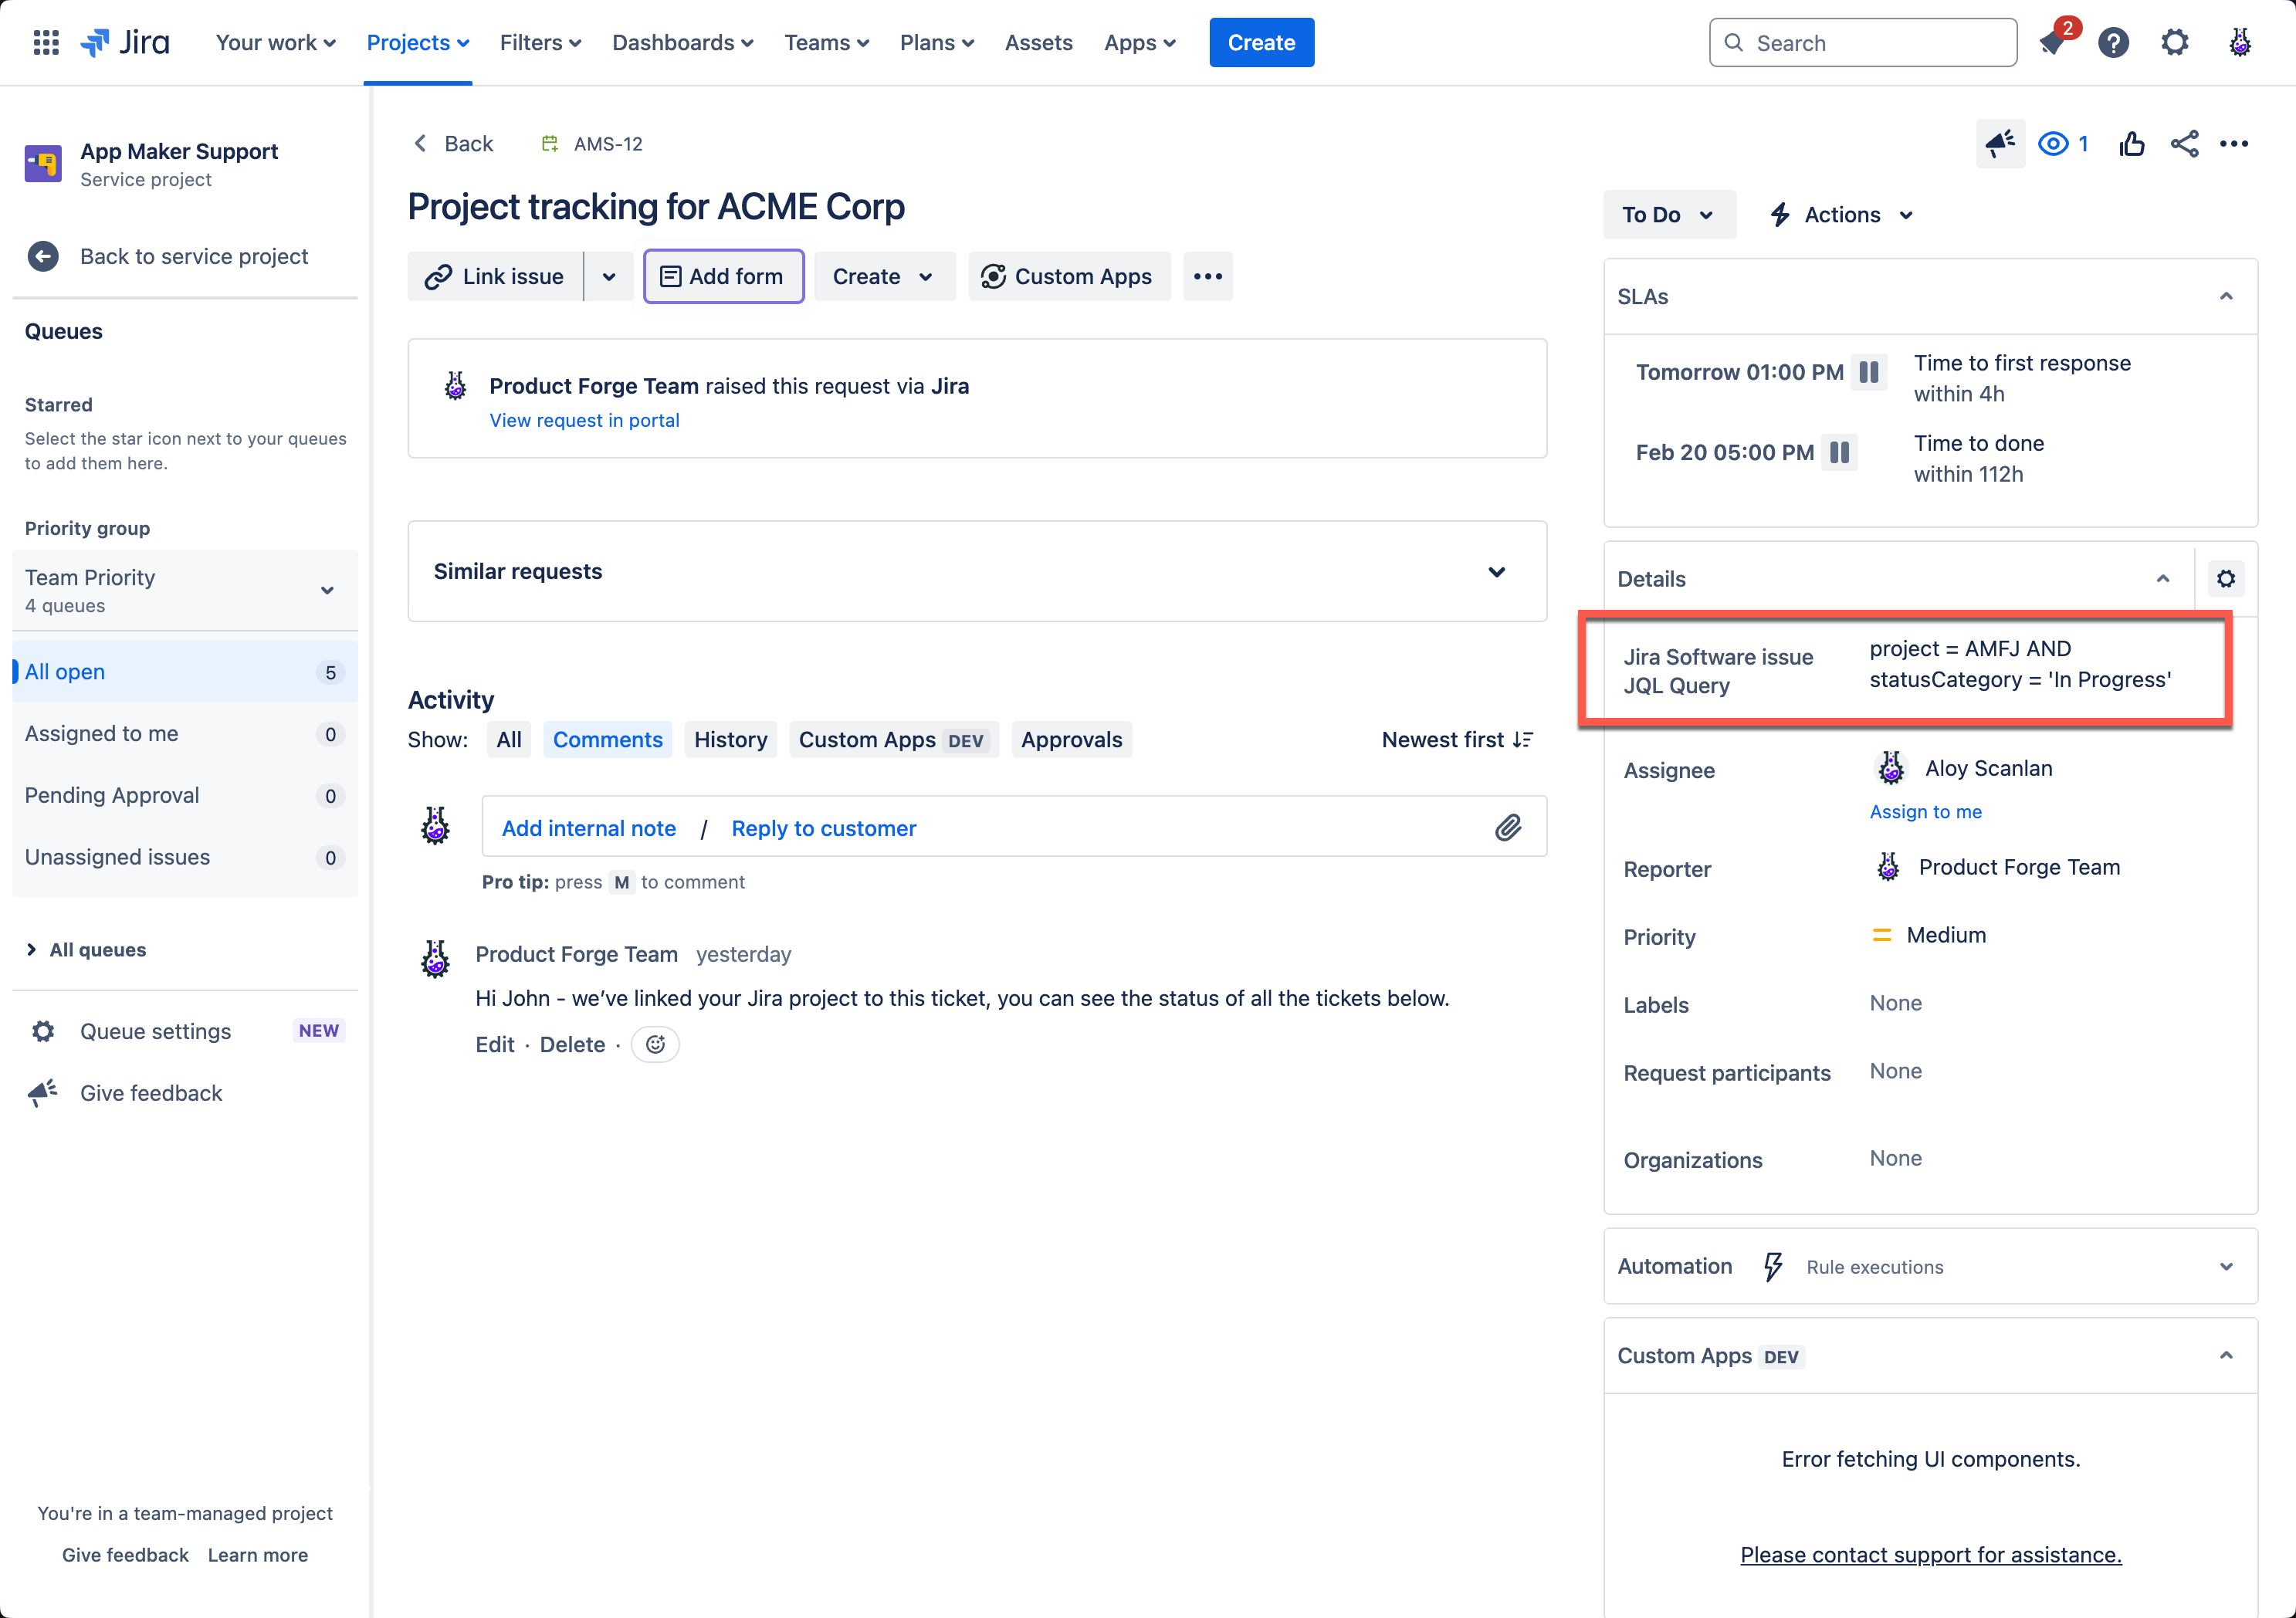
- Open that ticket via the JSM Agent view, where you can see/edit the ticket details.
- Edit the "Jira Software issue JQL Query" field and add a JQL query to fetch the issues you want to display.
- Remember, this query is meant to just be used for this ticket, so write it so that it only shows the issues you want to show to the people who can view this ticket in the JSM portal.
JQL Query Field in JSM Ticket
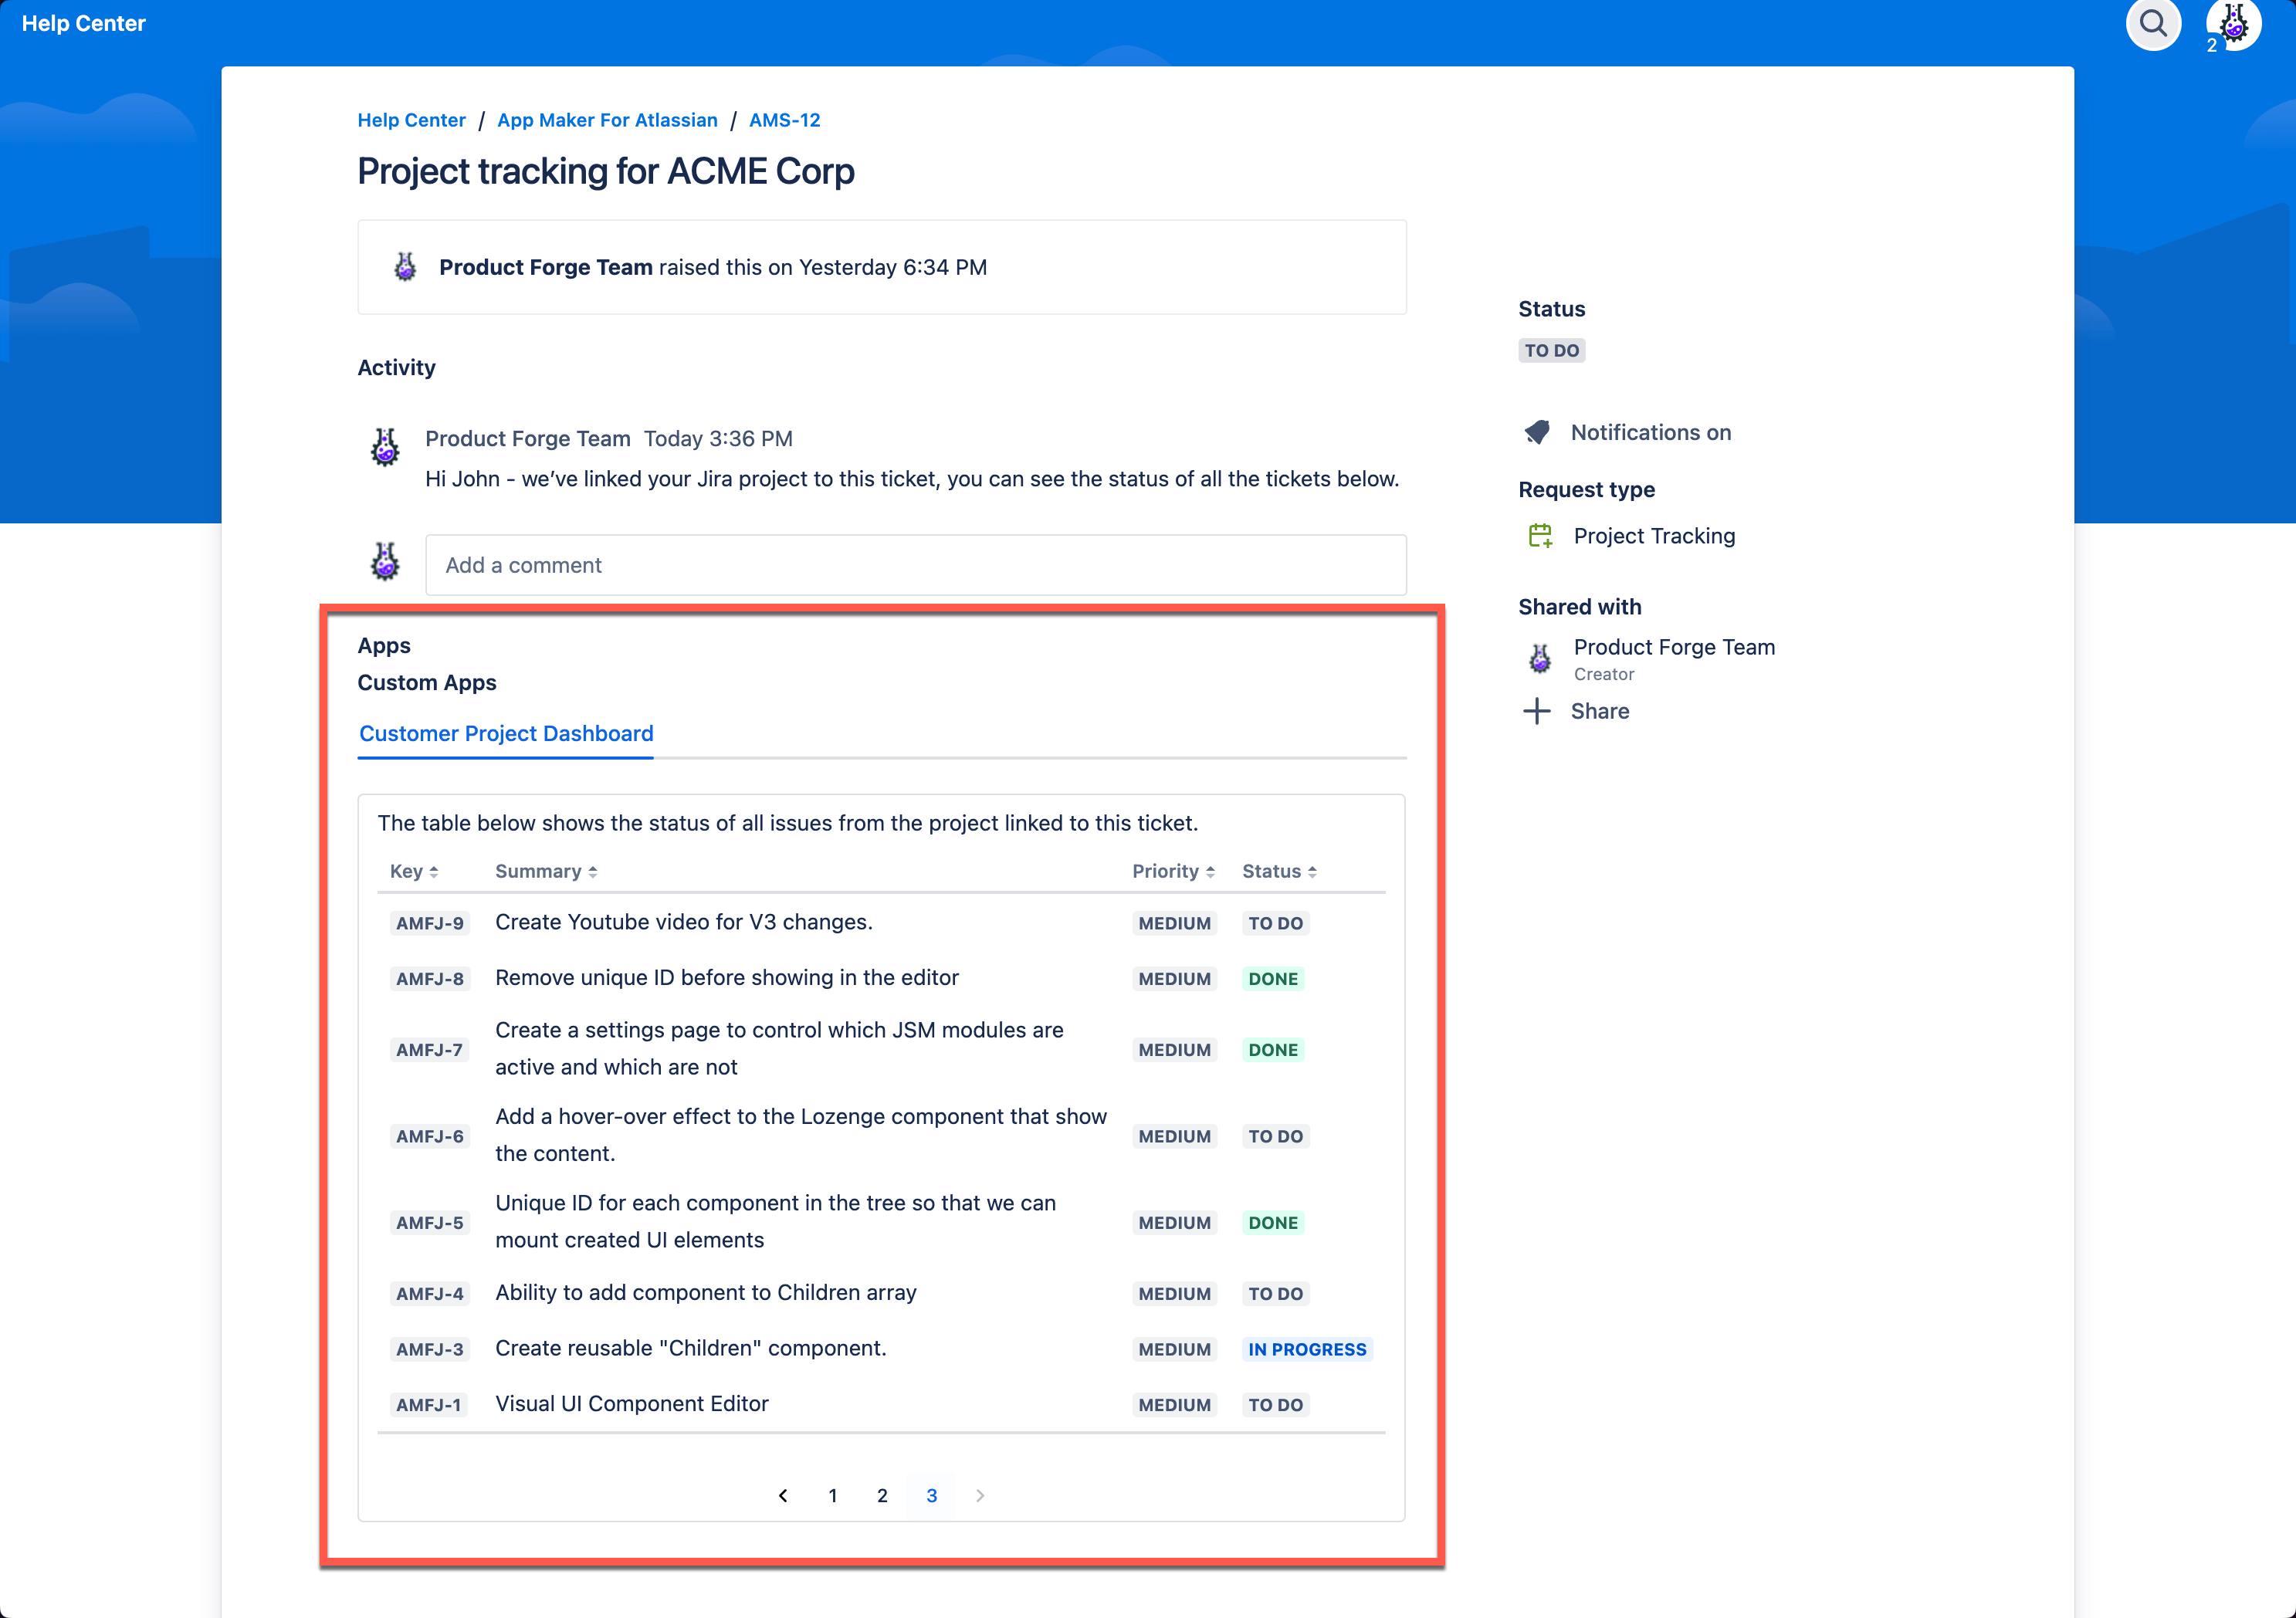
- Once done, head back to the ticket view in the JSM Portal and refresh the page.
- You should now see the issues from the Jira Software project displayed in the table.
JSM Portal Project Dashboard with Issues